Some classic models are like breathing—always with us, whether or not we consciously notice them or put them to use. One such model is the product growth curve: a framework that’s been echoed time and again in management and marketing literature. And yet, when it comes to strategy and planning, it’s as if we’ve never heard of it.
This piece is a gentle reminder. Why do we sometimes move past the classics? Have we merely memorized them, or have we truly felt them in our bones?
The Fateful Path of a Product
As someone who’s about 98% deterministic by belief (the remaining 2% I’ve reserved for playing both sides), I quite like the sound of this title. Of course, fate and determinism aren’t quite the same: determinism is what circumstances impose on us, while fate—at least in how we tend to see it—suggests there’s some meaning or purpose behind the compulsion. But maybe much of what we call “fate” is simply recurring patterns in disguise.
On the surface, some product growth paths look like a pre-written fate—as if their destiny was sealed the moment they were born. But let’s be clear: that’s just a metaphor. What we’re actually dealing with is rooted in data and pattern recognition, not myths and make-believe.

Does the Destiny of Products Have Only One Shape?
Right from the start, it’s worth saying: we can’t explain all phenomena with just one graph—especially when it comes to the variety of growth functions. Some phenomena follow exponential functions, others grow with logistic or sigmoid curves, and some display cyclic or even random patterns. These differences reflect the complexities of the phenomena’s context: from network dynamics and social contagion to the structural limitations of markets.
In fact, we live every day in a world of simple and complex mathematical equations—equations that our evolved brains (for better or worse) are not fully capable of understanding. However, it seems that the logistic growth curve remains one of the most prominent indicators of destiny… destined, it seems, for many products!
A Simplified Rule for Better Analysis
With a bit of caution and a fair amount of simplification, we can say:
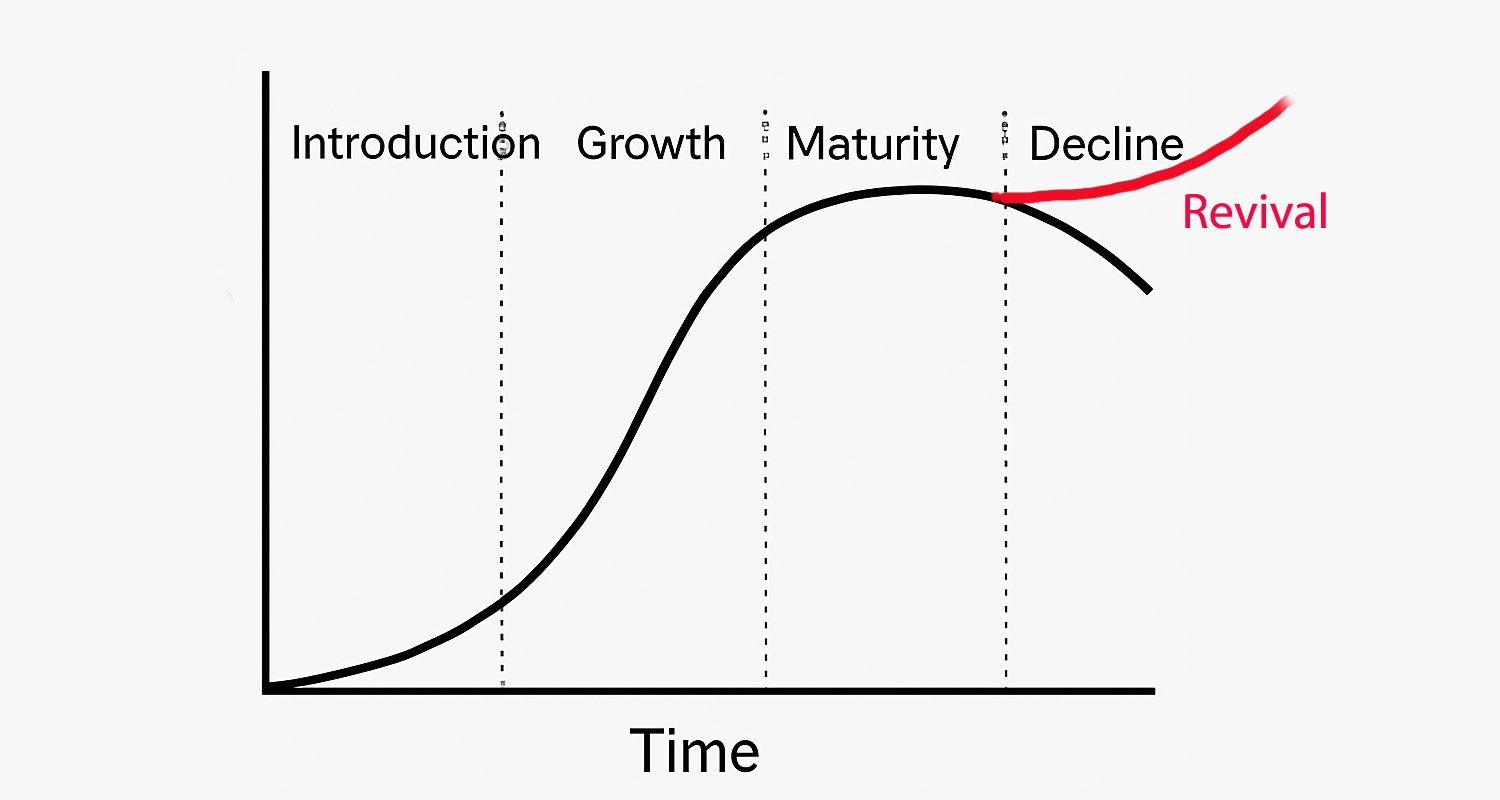
Many successful products—that is, those that have entered the market, grown, endured, or embedded themselves in consumers’ minds—follow an S-shaped growth pattern: slow start, acceleration, reaching saturation, and sometimes decline. Of course, there are exceptions in some industries and conditions.
What Do I Mean by Product?
In this article, “product” doesn’t simply refer to a physical good or an app; it’s anything that enters a visible life cycle, is launched into the market, finds users or an audience, and evolves or transforms through interaction with them. This definition can include a physical product (like a bicycle), a digital app or platform (like Notion or TikTok), a cultural or digital piece of content (like a series of stories or an NFT), and even a specific technology or brand.
Ghazal, What Happened to Your Data-Driven Approach?
Was this the vision we had? How far do we really need to simplify things? Let’s be honest: for every product, this level of data-driven focus may not be possible. Sometimes the necessary infrastructure isn’t there. Other times, the volume of data isn’t even worth modeling. So yes, revisiting classic models—even with a critical eye—can still be useful. However, before we dive deeper, it’s important to remind ourselves that while the S-curve is practical and familiar, it’s just a classic approximation of reality. In today’s complex and digital environments, products don’t always follow a neat, linear path. Sometimes their trajectory is non-linear, sometimes it branches out, and sometimes it’s so unique that no previous curve can fit. This is where data-driven models come in:
Models that don’t rely on pre-determined assumptions, but instead, based on real user behavior, real-time data, and machine learning, aim to reconstruct the true life cycle of each product. Unlike standard curves, these models adapt to the complexities of the environment.
But Let’s Assume I’m a Cucumber Seller or a Creator of an Unheard-of App in a Startup, with Half-Baked Data Infrastructure.
Should I throw in the towel on analysis and forecasting just because I don’t have data? No. Even then, classic models—especially the S-curve—can still be inspirational and insightful.

Now that I’ve made this simplified statement, it’s time to address the exceptions. Not everything follows the S-curve, my friend! And in the end, we’ll see what applications these simplifications have and when we should treat them as tools—rather than as absolute truths.
First Exception – Cultural Products
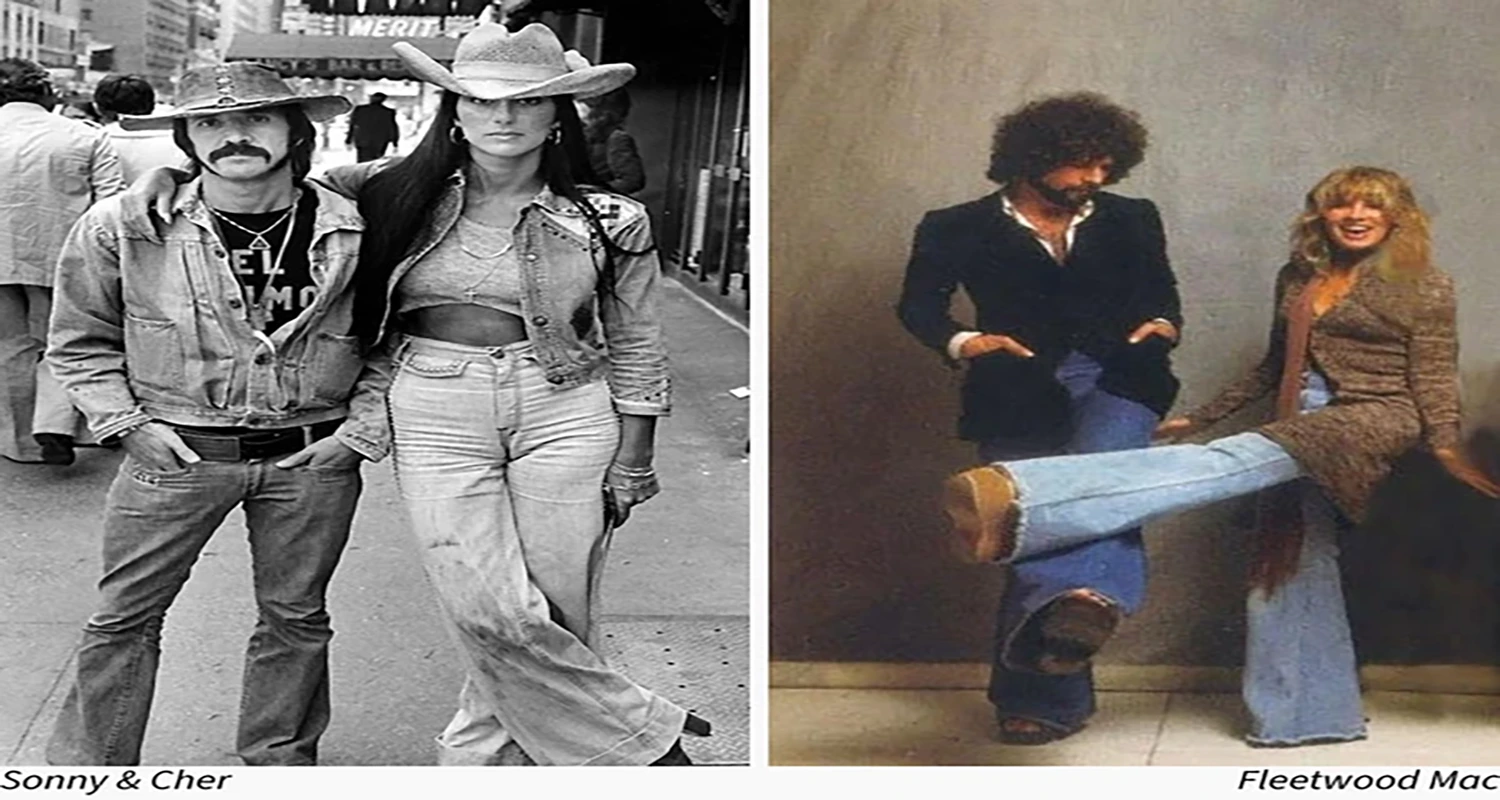
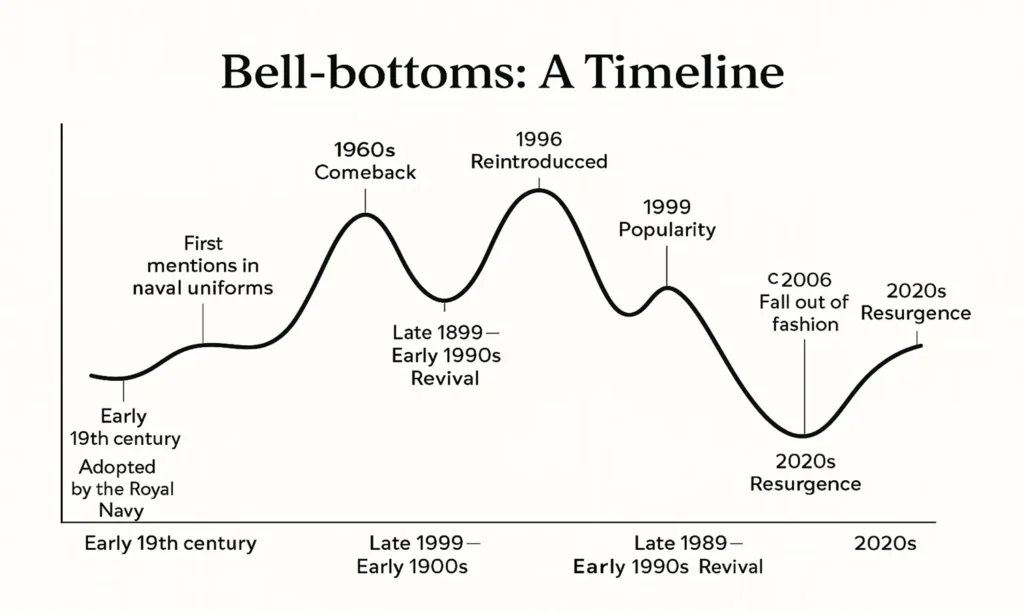
Some cultural products, unlike the predictable trends in the logistic growth curve, exhibit non-linear and sometimes cyclical dynamics. For example, an emoji, an old song, or a fashion style might suddenly resurface and trend again after years of being forgotten. This phenomenon, known in growth literature as revival waves or re-adoption, is especially common in products tied to taste, nostalgia, or social waves.
Sometimes, these cycles overlap with the logistic pattern—like during the first wave of adoption—but the trajectory that follows is shaped by forces like nostalgia, social media networks, or platform algorithms, which diverge the growth pattern from the classic model.
Especially when it comes to content with viral potential—such as comedic clips or digital trends—the growth behavior tends to follow cultural models, meme theory, and network expansion.
Therefore, cultural products are a serious exception to the simplified growth model. Their behavior is not only non-linear and repetitive, but they may enter phases of growth, saturation, decline, and then revival multiple times—a behavior explored in post-logistic models.
Explosive Cycles
If you have kids around or relatives with young ones, you’re probably familiar with Pokémon! This beloved franchise began in 1996 with Game Boy games, became a cartoon in 1997, and in 2016, the augmented reality mobile game Pokémon Go brought excitement to everyone. Since then, Pokémon still has a large fanbase. But let’s take a look at the download timeline for this game:

This is an example of a product that experiences rapid growth and high adoption, but suddenly faces a sharp decline—often due to hype or fleeting trends. Pokémon Go, which had explosive downloads upon release, experienced this spike in just two seasons, but quickly dropped as public interest waned. However, when we say “decline,” it doesn’t take away from the value of Pokémon Go: in 2024, it still had around 37 million downloads!
Similarly, NFTs saw explosive and hype-driven growth, created by financial speculation, but after market saturation and the decrease in excitement, their value sharply dropped.
In such cases, the rapid rise and fall are not the result of a gradual curve, but rather the outcome of external pressures, social trends, and market excitement. Therefore, analyzing these products requires models beyond the logistic curve—models that examine wave-like, ephemeral, and explosive phenomena in consumer behavior.
Important Second Exception: Emerging Technologies
If you’re familiar with the world of classic business models, your mind likely jumps immediately to one of the most famous technology forecasting diagrams: the Gartner Hype Cycle.
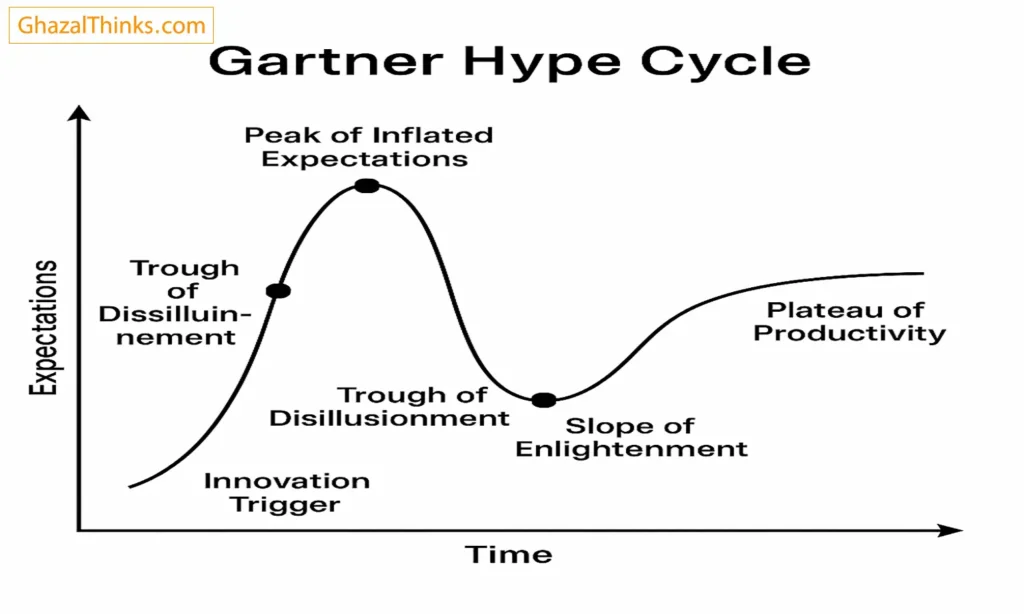
The Gartner model was first introduced in the 1990s by analysts at the consulting firm Gartner Inc. Its goal was to describe the psychological behavior and market expectations regarding emerging technologies. This model consists of five main stages:
- Innovation Trigger
- Peak of Inflated Expectations
- Trough of Disillusionment
- Slope of Enlightenment
- Plateau of Productivity
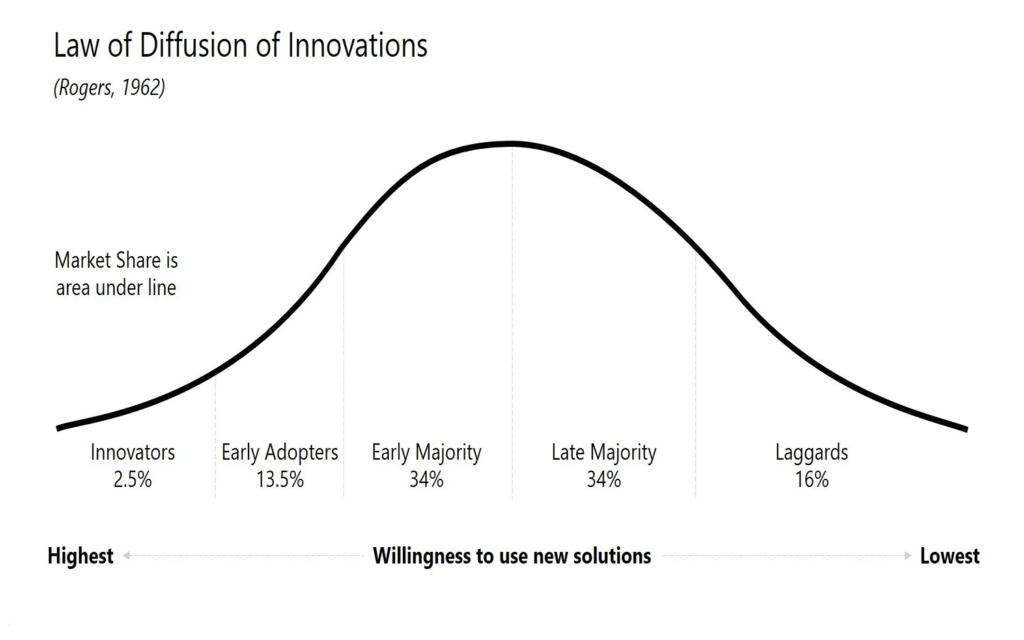
After research by three individuals on the diffusion of technology in U.S. agriculture in 1962, Everett M. Rogers generalized the findings in his book Diffusion of Innovations to non-agricultural sectors. This is the same model that identifies five types of consumers when adopting a new innovation:
Why Do I Consider the Classic Gartner Model an Exception?
The product growth curve focuses on market adoption (how actual consumers embrace the product), while the Gartner model measures the psychological behavior of the market (what exaggerated expectations or disillusionments exist?). In fact, the Gartner model, by focusing on the cycle of expectations, can complement the S-curve during the early phases—when actual adoption hasn’t taken shape and the product is still in the phase of market psychological discovery.
Moreover, this classic model pertains to the adoption of new technologies; yes, new products. So, if your product is entirely new—whether technologically (for example, the recent rise of generative AI globally) or conceptually and practically for the user (such as ideas like online car wash services)—your product will be creating a market.
If your product falls into this category, you need to consider this fundamental distinction throughout all stages of design, production, marketing, and growth— from content strategy to brand development. Such a product has different requirements, challenges, and opportunities compared to regular products; for example, part of your budget may go toward consumer education because you aim to introduce a new concept.
Summary So Far
In this article, we’ve taken a journey from the classic product growth model—the familiar S-curve—to the exceptions that challenge this pattern. We noted that while modern data-driven models are highly accurate and adaptable, sometimes we simply don’t have the right data for statistical analysis! So returning to classic models still holds value and defense.
We then reviewed three major exceptions:
- Cultural products with cyclical patterns,
- Explosive phenomena with rapid rise and sudden fall, and
- Emerging technologies that are better explained through psychological models like the Gartner Hype Cycle, rather than the logistic curve.
But the story doesn’t end here. In the second part of this article, we’ll explore two more intriguing exceptions—The Long Tail and Resistant Decliner. And most importantly, we need to get to this section soon: What difference does it actually make to know (or not know) the product life cycle model? Where should we use it as an analytical tool, and where should we distance ourselves from it to avoid falling into the illusion of certainty?
The accompanying audio for this article is Chopin: Mazurka No. 23 In D Op. 33 No. 2
")
