In the first part of this article, I touched on the product life cycle (PLC) and the classic logistic growth model—a framework that has long echoed through the halls of business theory. With caution, I proposed a simplified rule of thumb:
Many successful products—that is, those that made it to market, grew, endured, or earned a spot in the consumer’s mind—tend to follow an S-shaped growth pattern: a slow beginning, an acceleration phase, saturation, and at times, decline.
This raised a key question: Is this model truly a kind of preordained destiny for every product’s life cycle? Is the logistic curve a fixed rule, or are there meaningful exceptions? In Part 1, I explored two major ones: cultural products and emerging technologies.
In this second part, we’ll examine two more important exceptions—The Long Tail and Resistant Decliners along with a side note on platforms. And most importantly, we’ll explore why this rule even matters. When does knowing the product life cycle model help us—and when might it mislead us into false certainty.
Exception #3 to the Product Life Cycle: The Extended-tail distributions
Our species cannot survive without simplification—but simplification is also our Achilles’ heel. We tend to assume most phenomena are predictable and most statistical distributions are neat and normal. But the world doesn’t always play by Gaussian rules. Sometimes things appear with shocking intensity, or grow so slowly and quietly that we don’t even notice until much later. This is where “tails” come in—not just any tails, but fat and long ones.
In recent decades, Nassim Taleb and Chris Anderson, have highlighted how fat tails (or heavy tails) and long tails reveal cognitive blind spots in our understanding of risk, value, and markets.
Normal Distribution
If you’ve taken statistics in school, you probably remember that a distribution is a way to show how often a phenomenon occurs. This is the beloved bell curve—a normal distribution:
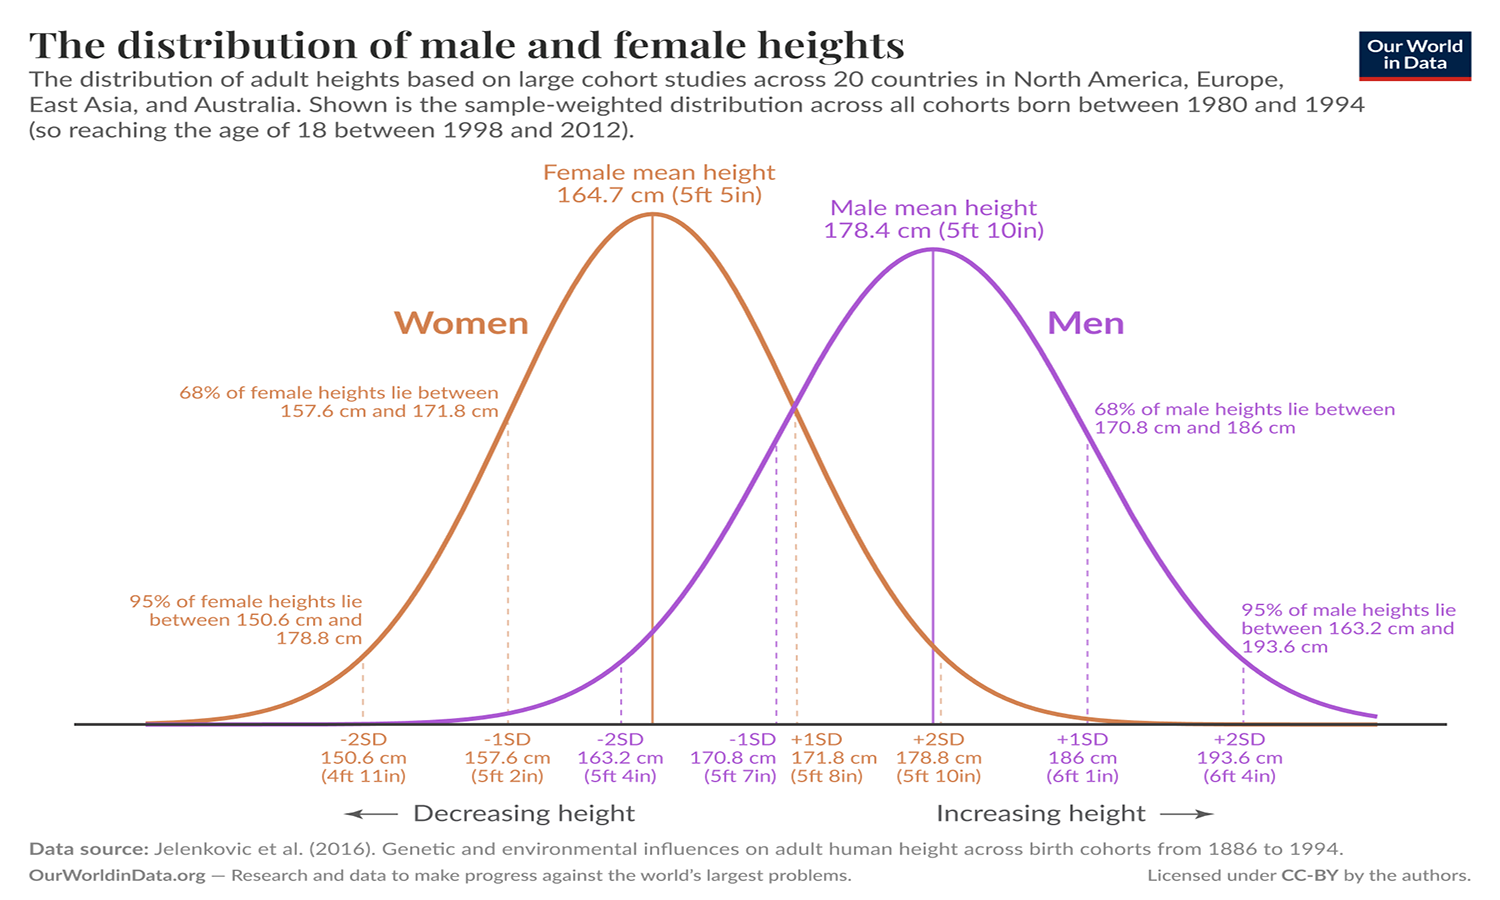
This example comes from human height data on Our World in Data: the average height for women is 164.7 cm, with a standard deviation of 7.07 cm. A woman shorter than 143.49 cm or taller than 185.9 cm falls into just 1% of the population. In other words, 99% of the data sits comfortably within three standard deviations of the mean.
How elegant and predictable! But the graph reveals something else: it has a short tail.
In a normal (Gaussian) distribution, the probability of extreme values rapidly approaches zero. The tails taper off so quickly that highly unusual events are vanishingly rare. And that’s exactly what makes Gaussian distributions so useful: they’re mathematically tractable and play well with standard statistical methods. There’s just one problem: most real-world phenomena don’t follow a normal distribution. Instead, many follow fat or long-tailed distributions.
Extended-tail Phenomena: Risk, Inequality, and the Unexpected
Fat Tails and Risk
Distributions like Pareto, Cauchy, log-normal, Zipf, and others in this family don’t fade away quickly at the edges. They’re “fat-tailed,” meaning:
- The probability of extreme events far from the average is non-zero and meaningful.
- These probabilities decline, but very slowly—so rare events can carry serious statistical or economic weight.
- Mathematically, the tail decays according to a slow exponential or power-law function. (See Footnote [1] for a deeper dive.)
Let’s say we’re feeling optimistic: “The world’s getting safer,” we think. So we underinvest in healthcare infrastructure and divert resources to shinier, trendier projects. Then COVID appears—seemingly out of nowhere. Why were we blindsided? Because we wrongly assumed the world follows a normal distribution. But risks like pandemics belong to the realm of fat-tailed distributions. In these domains, rare but catastrophic events are not outliers—they’re part of the game.
In geology, for instance, the Gutenberg-Richter Law tells us that earthquake magnitudes follow a power-law distribution. Disastrous quakes are rare—but not rare enough to ignore.
Pareto: Inequality in an extended tail
Fat tails don’t just describe natural disasters—they explain inequality too. Ever heard of the Pareto Principle?
Pareto’s law suggests a deeply rooted asymmetry in the world: 80% of effects come from 20% of causes. The richest 20% hold 80% of global wealth. 80% of your income may come from 20% of your clients. You get the idea. We won’t stray too far here—Wikipedia has more if you’re curious.
The Long Tail: Where Opportunity Hides
But non-normal distributions don’t always spell doom. Sometimes, they open the door to opportunity. Enter the long tail.
Unlike fat tails, which imply a small number of intense, rare events, long tails suggest a large number of rare events—each individually insignificant, but collectively powerful. Long-tail distributions contain countless low-frequency items, which, in aggregate, make up a massive share of the total market.
Chris Anderson introduced the concept in a 2004 Wired article, then expanded it into a bestselling book: The Long Tail: Why the Future of Business is Selling Less of More (2006). His core argument: in digital economies, focusing solely on bestsellers is only half the equation. The real gold lies in aggregating the “misses”—the obscure songs, niche books, or long-forgotten gadgets that still have a small but steady audience.
In July–August 2006, Harvard Business Review published a critique titled “Is the Long Tail Really Profitable?” sparking a back-and-forth between Anderson and Anita Elberse. (See Footnote [2])
A Quick Recap of the Three Major Non-Normal Tails
- Fat Tail: Rare but devastating events—like earthquakes or pandemics.
- Pareto: Structural inequality—where a few account for the many.
- Long Tail: Many rare, low-demand items that collectively matter—like obscure books or niche playlists.
Coming up next: we’ll dive deeper into the long tail—with a real-world example that brings the concept to life.
Here’s the English translation of your latest section, keeping the English-1 tone: conversational, analytical, metaphor-friendly, and strategically reflective.
The Long Tail in Business and the Digital Economy
Imagine you ran a bookstore. Would the number of copies sold per book follow a short-tailed distribution—or a long-tailed one? We’re not talking about total sales, but the distribution of sales per title.
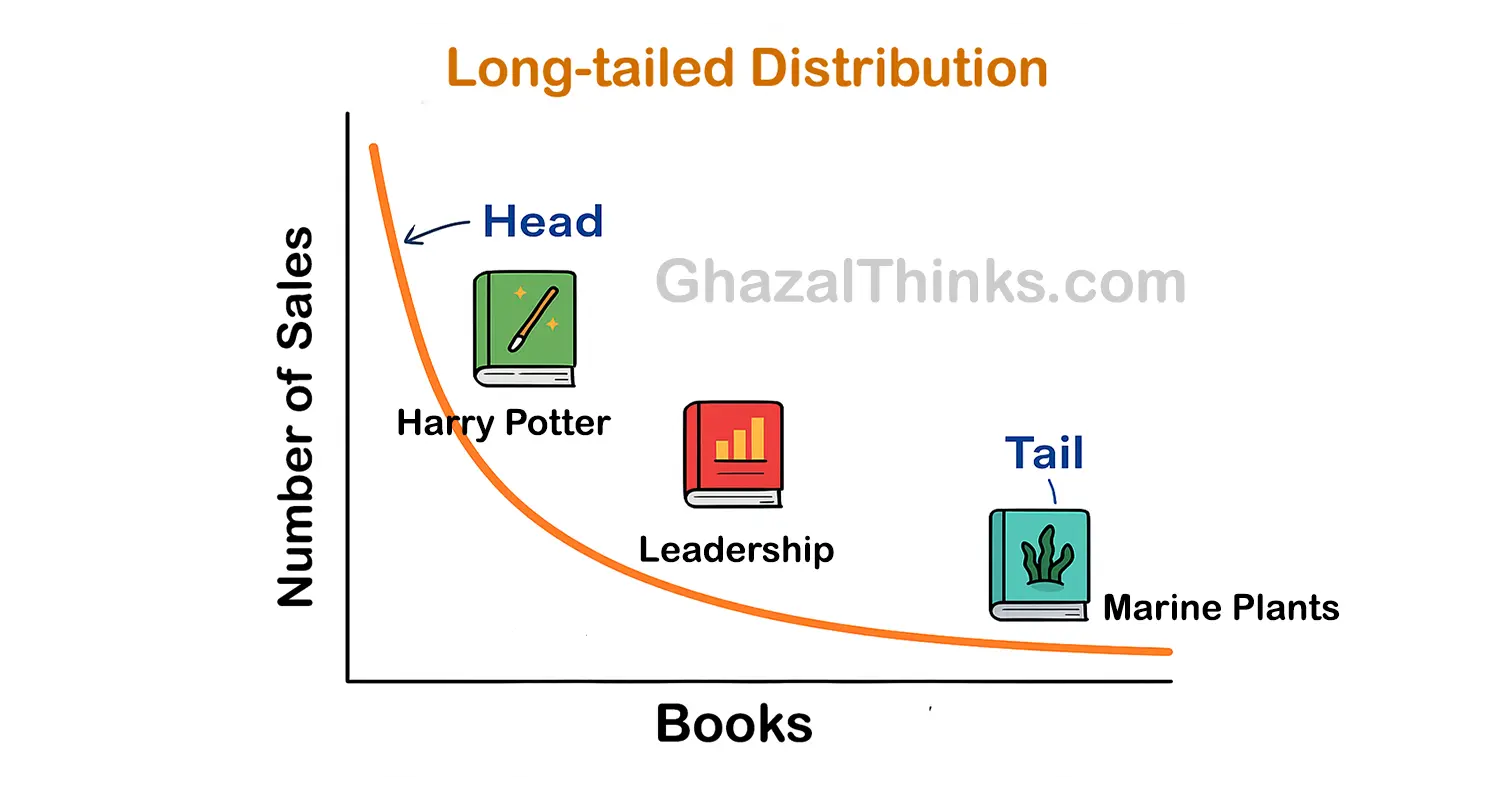
At the “head” of the distribution, you have bestsellers like Harry Potter—high in volume, but few in number. Then comes the long middle: moderately selling titles, maybe books on management. And finally, way down the tail, we find thousands of obscure, low-volume titles. Think: A Guide to Marine Plants for Coldwater Tanks.
Now here’s the twist: each of those niche books may only sell a few copies, but taken together, their collective sales can rival—or even exceed—the sales of the bestsellers.
As a physical bookstore owner, it made perfect sense to focus only on the head of the curve—space was limited. Even if you had the shelf space (say, in Tehran’s Enghelab Street), your foot traffic was still finite. It was rational to ignore the tail. The low-demand stuff just didn’t seem worth it.
But what if you had infinite shelf space? What if you had access to millions of potential customers—and storing books cost almost nothing? Would you still ignore the tail? That’s the core question Chris Anderson raised when he coined the term The Long Tail.
Netflix and the Long Tail in Action
Let’s bring Netflix into the picture.
Before the internet, media companies followed a blockbuster model: create or distribute a handful of hits that appealed to the masses. Why? Because resources were limited—DVD stores had finite shelf space, airtime was finite, and advertising budgets couldn’t justify obscure titles. But then came Netflix and rewrote the rules. In the digital realm, storage is nearly free, and there’s no “shelf” to run out of. Every movie—no matter how obscure—can be hosted, streamed, and recommended. And this is where recommendation algorithms come in. They surface niche content, tailored to individual tastes, even if the title sits deep in the tail.
A Moment of Pause: Does the Long Tail Always Work?
Anderson’s long-tail theory sounds elegant. But when does it actually apply?
- In which kinds of markets does the long-tail strategy really pay off?
- How much product variety, consumer base, and discovery infrastructure do you need for the tail to turn profitable?
- In niche digital markets, is sustainable growth really hiding in the tail—or does it still come mostly from the middle and the head?
- In a world of scarce attention and high switching costs, can every product survive in the long tail? Or only those with solid distribution?
And here’s a final provocation: Is invoking the long tail without data just a romantic oversimplification? If you had to warn someone not to fall for the mirage of the long tail, what would you say?
Let us know in the comments.
A Conceptual Interpretation: A Long-Tail Product Lifecycle
While the long-tail concept is often used to analyze market structure or digital retail strategies, it can also be viewed as a nontraditional product lifecycle model—especially for products that don’t follow the classic logistic S-curve of “boom–saturation–decline.”
To be clear: this is not a formal definition, but a useful analytical lens. In a long-tail lifecycle, value doesn’t come from explosive growth followed by market saturation. Instead, it comes from slow, steady trickles over time. Here, a product launches with modest demand, never becomes a mainstream hit, but gradually finds a loyal niche audience. It doesn’t surge; it seeps—and may continue seeping for years.
Instead of the familiar S-curve, the lifecycle graph here looks like a stretched, low-slope line—classic long-tail behavior.
Examples:
- A veterinary accounting app designed only for small animal clinics
- An advanced-level video course on flute technique
- A philosophy of science podcast for hardcore academic listeners
So far, we’ve explored three major exceptions to the classic product lifecycle model: cultural products, emerging tech, and long-tail phenomena.
Next, we turn to a lucky subset of products that just don’t seem to die easily.
Exception #4 to the Product Life Cycle: Resistant Decliners
Some products owe their longevity neither to nostalgia, nor to advertising, nor even to flashy innovation. These are products locked behind patents, protected by massive infrastructure, or sheltered by political lobbying. Others meet essential, irreplaceable human needs. These are the resistant decliners—products that may never truly decline, or if they do, it happens slowly, almost imperceptibly. In some cases, global demand even pushes them into growth territory—until the tide turns: a new policy, a breakthrough technology, or a fierce competitor shows up to disrupt the status quo.
Economists call these products “price inelastic”—demand barely budges even when prices surge. But this same feature makes them battlegrounds for political and ethical debates, especially when monopolists hike prices with impunity.

Other examples: insulin (quasi-monopolistic in the U.S.), vital drugs for rare diseases, certain chemical fertilizers, some semiconductor technologies.
But some resistant decliners are naturally irreplaceable—meaning they’re not necessarily the product of lobbying, regulatory loopholes, or shady politics. For example:
Blood screening kits—there are several brands worldwide and the market seems competitive, but in practice it’s “quasi-monopolistic” or “locked,” due to quality sensitivity, legal requirements, government protocols, standardization and calibration, and the loyalty of national food and drug agencies to specific brands.
The electricity infrastructure market (power distribution network)—the distribution network is usually a natural monopoly. The structure and technology make having multiple parallel networks in one area economically unfeasible, causing resource waste and discouraging massive investments.
Urban transport systems and water & sewage infrastructure are other examples of natural monopolies.
Resistant decliners are products that are either naturally irreplaceable or artificially made so—and sometimes both. Understanding this dual nature helps us differentiate between products whose longevity is truly their “destiny” and those that last only because of lobbying and market games (like EpiPen in the U.S.). For these products, we shouldn’t apply a classic product life cycle growth model.
Now that we’ve talked about products whose long life depends more on their nature or market structure than on innovation, it’s worth turning to the world of platforms; skipping that would mean missing a complex exception.
A side note on the product life cycle of platforms
For multi-sided platforms (think Uber, Airbnb, or major marketplaces), growth trajectories often don’t follow the classic logistic curve pattern. This difference mainly stems from two-sided network effects and the critical need to balance supply and demand simultaneously. In these ecosystems, growth can be nonlinear and even occur in stages—depending on which side of the platform (e.g., driver or rider, seller or buyer) hits the tipping point first. This is a complex world in its own right, quite far from the simplified logistic model. Diving deeper deserves its own dedicated article; here, I’ll just briefly point it out.
So far, we’ve talked about the product life cycle—how products move through different stages typically represented by an S-shaped logistic curve. But really, why should we even think about product growth curves and product lifespans?
Why does the S-shaped product growth curve (PLC) and attention to the product life cycle matter?
Ahead of any business/marketing/product/growth manager lies a multitude of topics and activities they must directly or indirectly decide on or oversee with their team. For example:
-
When should I start picking up the first signals that it’s time to find a new path for market/product/brand development?
-
Am I fighting for a dead market? Or a product that no one’s excited about anymore? Or am I just waiting for the market to kick me out?
-
Do I have a cash cow that I still see as a racehorse? Or am I alert enough—depending on industry, product, and market—to foresee my product’s death or decline 5 to 10 years in advance and start thinking about exit strategies or the Ansoff Matrix?
-
When do aggressive pricing strategies work? When are psychological pricing moves destructive? When does subsidizing benefit me?
-
When is it time to focus on Acquisition, Retention, or Lead Generation? Which growth engine should I use now? Or maybe content marketing experts have told me that lead generation is great for any business at any time, just don’t miss out on it! Honestly, I think those experts have just heard it from HubSpot!
-
Is my marketing model aligned with the product’s current life stage? Or am I still trying to grow the product at maturity using introduction-stage tools?
-
How much money should I pour into branding? Is now the right time for an outdoor brand awareness campaign? Or has my brand consultant dazzled me with tales of Mercedes, Coca-Cola, and Rolex so much that I burn poor money on a branding campaign regardless of timing—a fire that ultimately fuels a dim, fleeting, and ineffective star? Or, on the contrary, have I recognized the right time to build the brand; or will I be playing with price tomorrow?
-
What budget should I allocate for my marketing department?
Let’s reflect on these questions—whether for our own business or those we work for.
To craft product growth strategy, pick market development paths, choose the right marketing channels, allocate budgets, and guide overall marketing and branding—whether to focus on product development or brand building—one critical variable must be factored into decisions: the product’s life cycle stage.
This two-part article has been an effort to highlight one of the most important variables for deciding on the questions above: the PLC, or product life cycle.
The danger of single-variable analysis
Single-variable analyses are a bias toward the valleys of downfall. Is the PLC alone enough for our decision-making in marketing, product, and brand?
-
When we want to define the marketing mix;
-
When we want to set pricing strategy;
-
When we want to allocate budget to branding;
-
When we want to determine communication and PR strategy;
-
When we want to stabilize product positioning;
-
When we want to review distribution channel strategy;
-
When we want to decide on content and advertising…
For these decisions, we must consider all variables and avoid single-variable decisions.
So, what are all the variables?
-
Industry analysis: alignment and conflicts of stakeholder interests in the product/business industry, Porter’s Five Forces
-
Market type: market structure (monopoly, competitive, monopolistic competition), market dynamics (supply-demand shifts, growth patterns, seasonality)
-
Economic-political dynamics, and generally PESTEL factors related to the product/business
-
Consumer knowledge and behavior: consumption patterns, buying behavior, cognitive mechanisms of product adoption, customer journey, demographic and psychographic traits
-
Product characteristics: product/brand life cycle stage (introduction, growth, maturity, decline), novelty vs. mainstream, stickiness, repeat purchase, expertise required for buying, perceived value vs. price paid, brand positioning in consumers’ minds, current market position (relative to competitors)
The product life cycle is just one piece of a larger map; but one piece alone, without all the others—without knowing the climate, weather, and rival paths—is not enough. For sound decisions, we must place it alongside other compasses and draw a bigger picture of the product and market journey.
Final Words
In the first part of this article, we began with a simple pattern: the S-curve of the product life cycle. A pattern that, at first glance, feels both intuitive and elegant—a product is born, it grows, reaches its peak, then declines or at least gets trapped in an endless plateau. But as we saw, the classic shape of the product life cycle is more of a mental construct than a hard rule—a subjective interpretation of the complex reality of markets. The purpose of these two pieces was both to challenge that mental model by highlighting exceptions, and to keep us focused on the product life cycle—one of the key variables in marketing and product decision-making.
Two exceptions were introduced in the first part:
- Cultural products
- Emerging technologies
Two more exceptions discussed in the second:
- Long-tails
- Resistant decliners
We also noted that the growth of digital platforms is a far more complex phenomenon, beyond the scope of these articles.
Perhaps, instead of asking, “Where am I on the S-curve?” we should ask, “Is there even a curve? If so, what shape does it take? If not, why not? How, then, might my product grow?” And most importantly: “How can I embed the stage of product/brand/business growth in all my decisions and marketing strategies?”
This shift in questioning moves us from accepting fate to designing the path ahead.
I look forward to your insights, critiques, and experiences.
Audio soundtrack for this article: Handel – Music for the Royal Fireworks, HWV 351: IV. La Paix
Footnotes
When we let the probability distribution functions tend toward infinity, aiming to see what their tails resemble, we arrive at these functions:

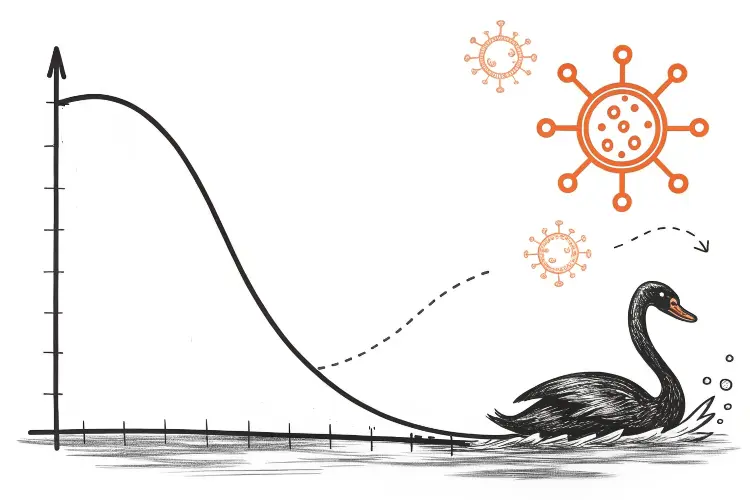
Which of these functions approaches zero the fastest? If you recall their shapes, it’s definitely normal first, then exponential, and finally Pareto last. Note that heavy tails can also be identified through survival functions and kurtosis measures. One important point to note: In the featured image of this article, you see a black swan. Black swans have more devastating impacts in fat-tailed distributions. However, it’s crucial to understand that a fat-tailed distribution does not necessarily imply the presence of a black swan — it’s the severity that matters.
For more detailed information, refer to The Statistical Consequences of Fat Tails by Nassim Taleb (PDF), especially chapters 1 and 2.
Harvard Business Review’s critique emphasized two points: first, many digital companies cannot easily cover the costs of distributing and marketing large volumes of niche, low-demand products; second, “brand power” and the “attention economy” mean only a handful of products or content become highly prominent, while access to a broader range rarely translates into significant sales. Moreover, in many markets, competitive conditions and consumer lifestyles mean that merely having an item listed online does not guarantee it will be seen or bought—unless companies invest heavily in advertising and targeted recommendation systems.
Still, it seems that in the digital economy, the long tail remains an important lens for content strategy, digital supply chain management, and consumer data analytics. My personal view is that no blanket rule applies to all platforms and retailers; decision-making must rely on data-driven approaches.

